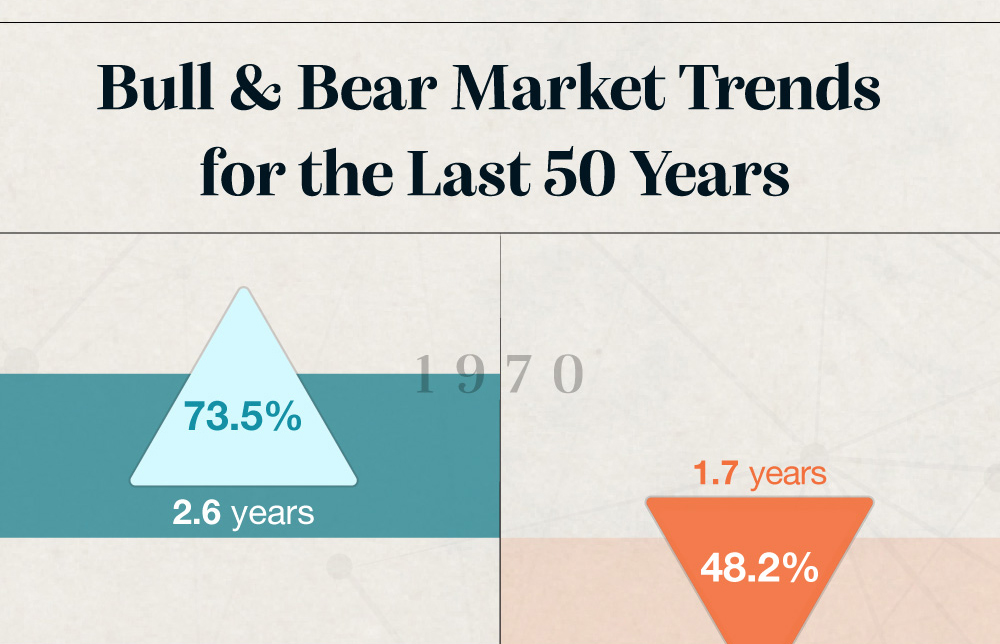
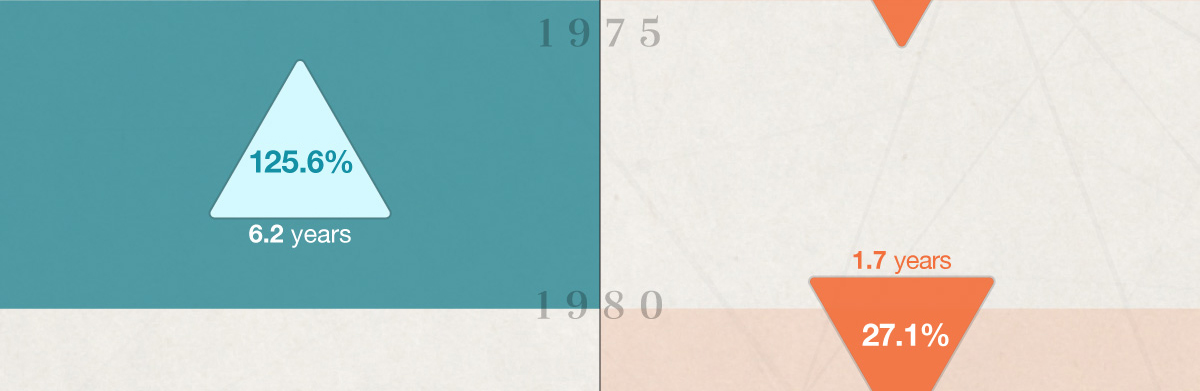
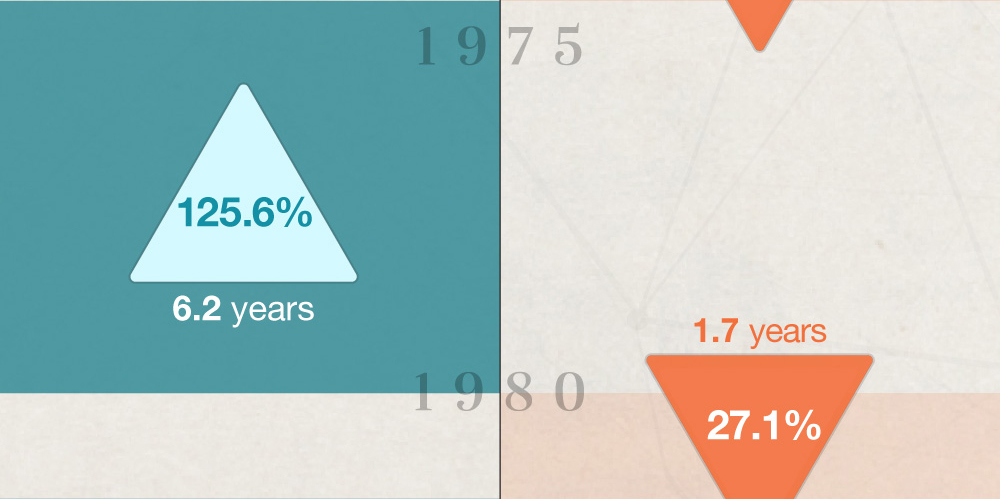
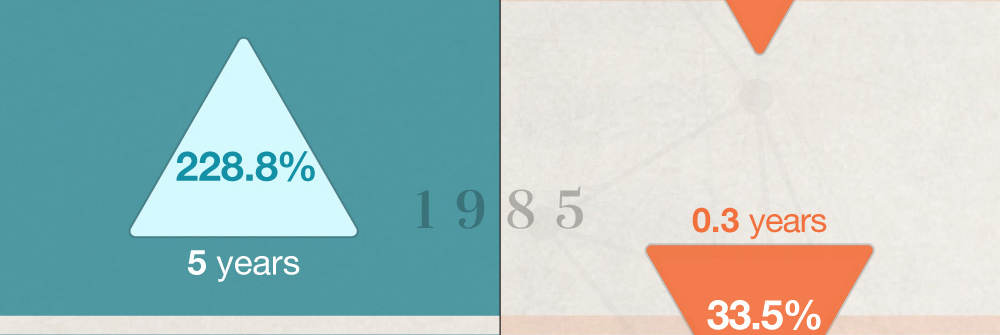
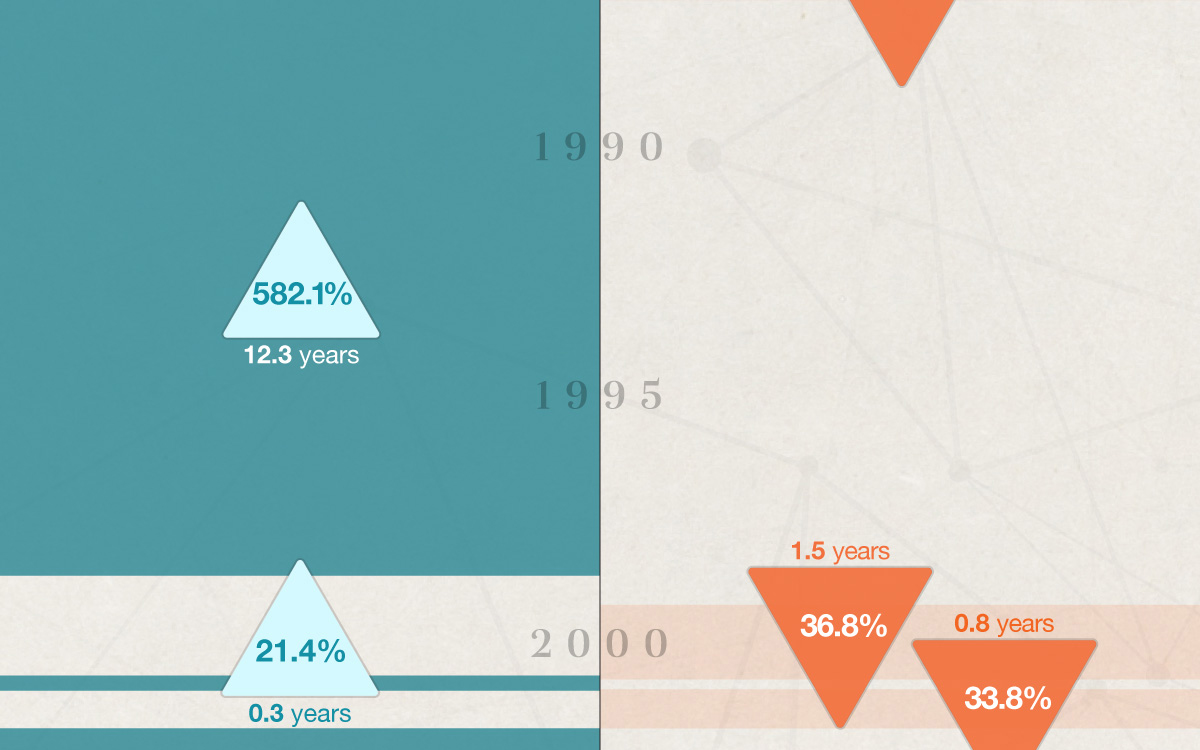
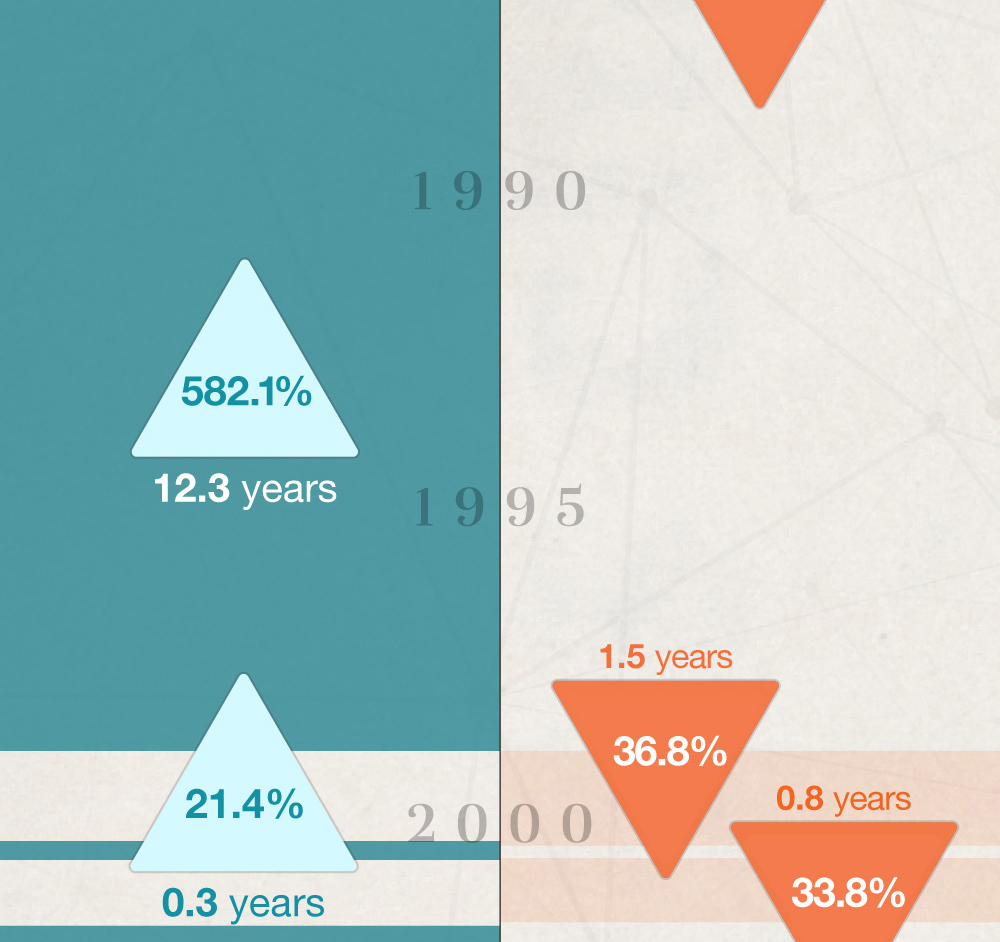
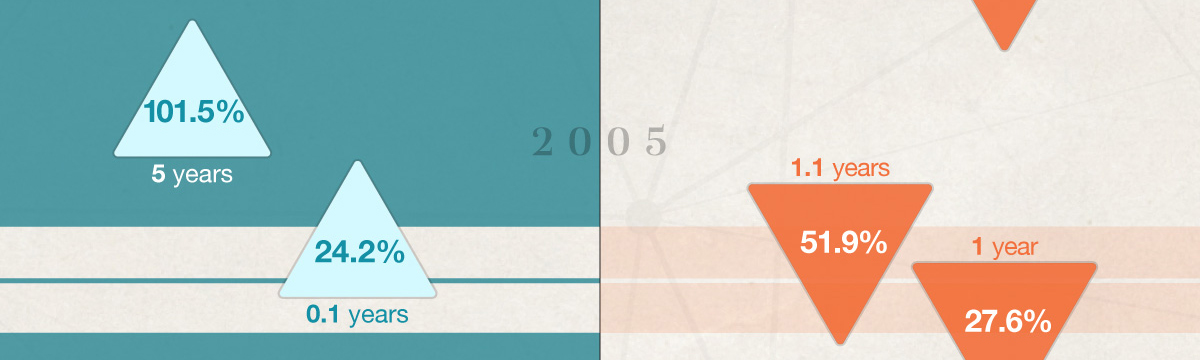
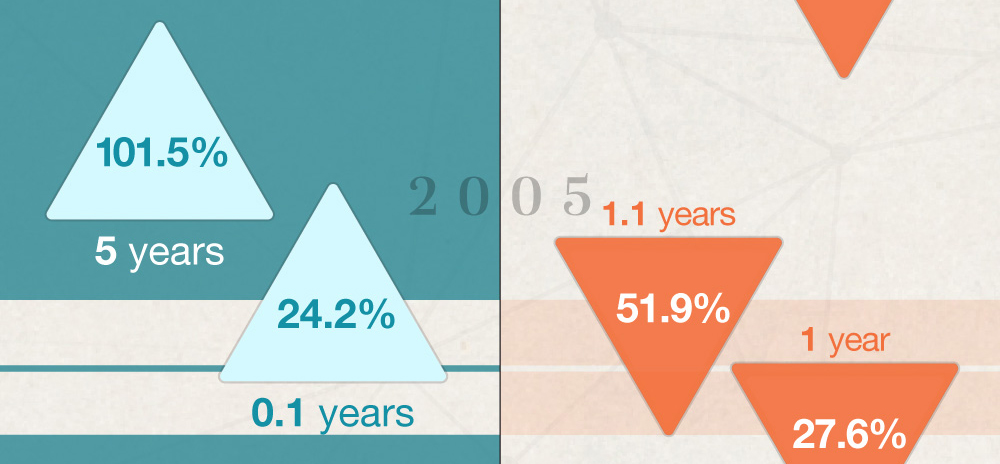
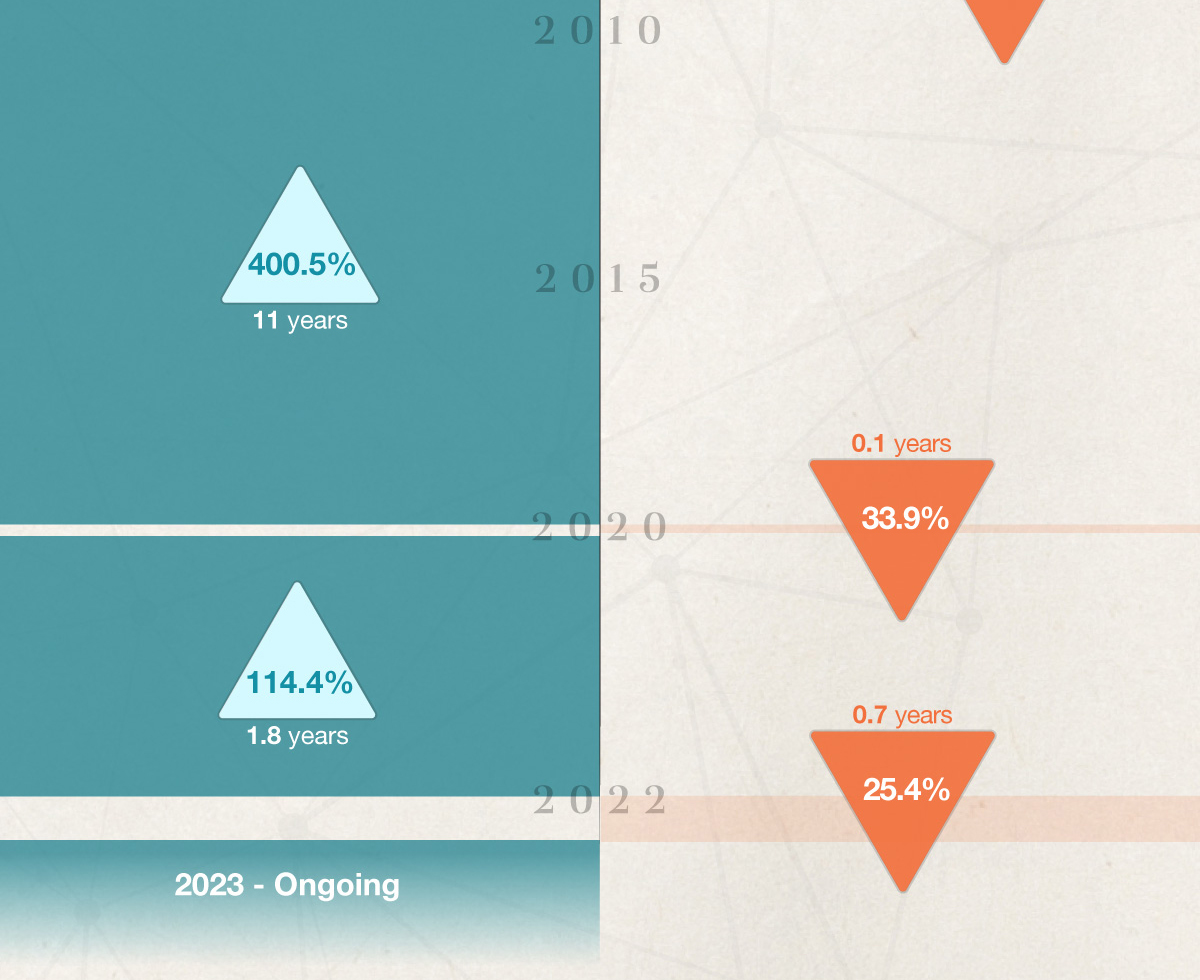
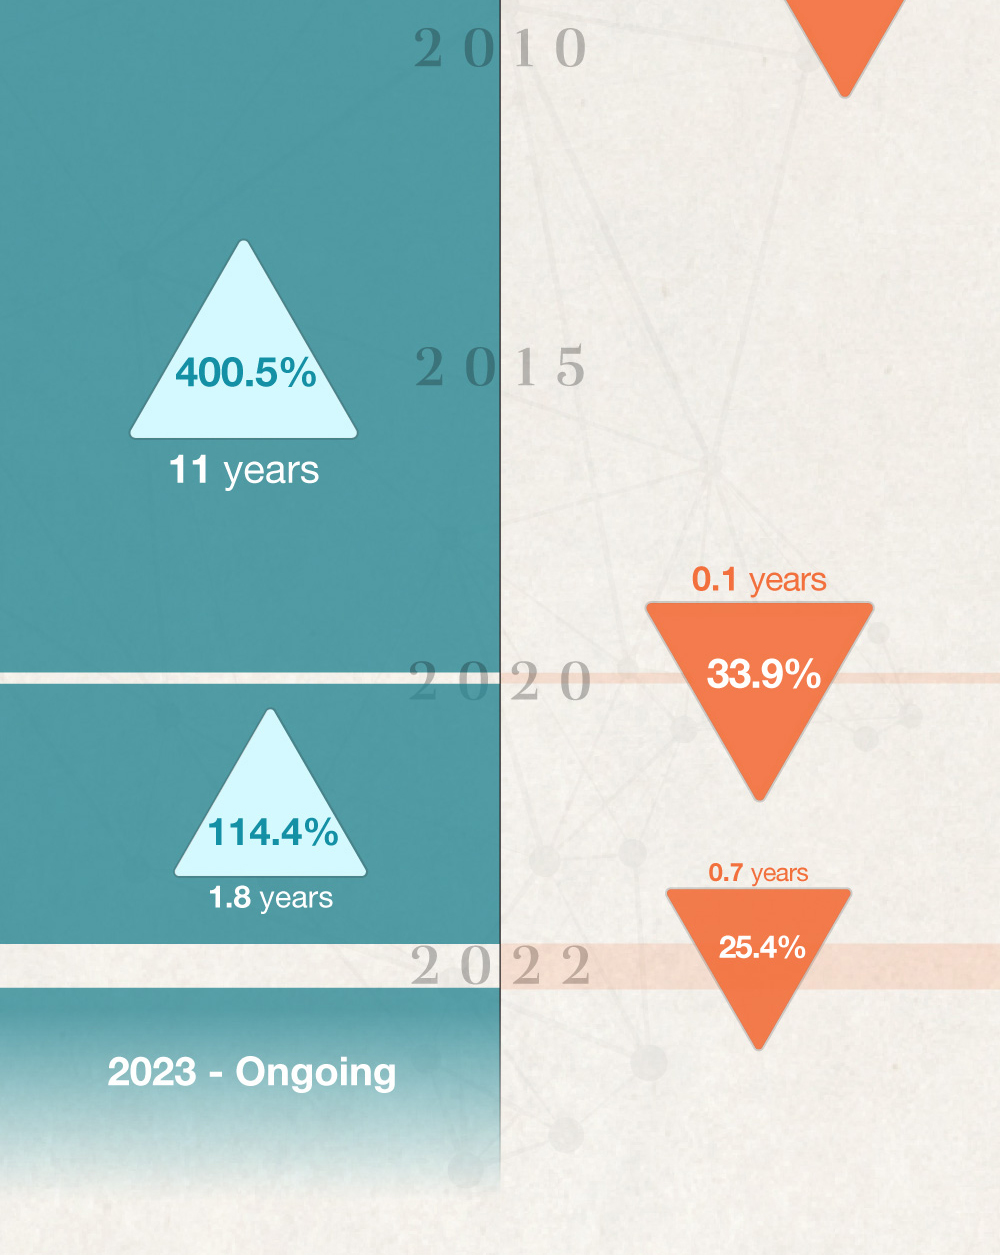
Bull & Bear Markets: A Timeline


What do concerns or uncertainty about AI mean for your future and your financial strategy?
Probate can be a completely public process, or it can be managed to include as little information as possible.
Term insurance is the simplest form of life insurance. Here's how it works.
Here are six flags that may make your tax return prime for an IRS audit.
Probate can be a completely public process, or it can be managed to include as little information as possible.
Do you understand these common mobile slang terms?
This calculator compares the net gain of a taxable investment versus a tax-favored one.
This calculator compares the financial impact of leasing versus buying an automobile.
Use this calculator to estimate your income tax liability along with average and marginal tax rates.
Lifestyle inflation can be the enemy of wealth building. What could happen if you invested instead of buying more stuff?
Peer-to-peer payment apps are one of the newest ways to send money.
When markets shift, experienced investors stick to their strategy.